OVERVIEW
The Global Interconnects and Passive Components Market is expected to hit USD 209.24 billion by 2025, rising by 5.01% to CAGR during the forecast period. Factors such as introduction of automation and robotics in the industrial sector, high speed bandwidth utilization in the data processing sector and compact electronic devices and consumer electronics sector are driving demand for Global Interconnects and Passive Components Market.


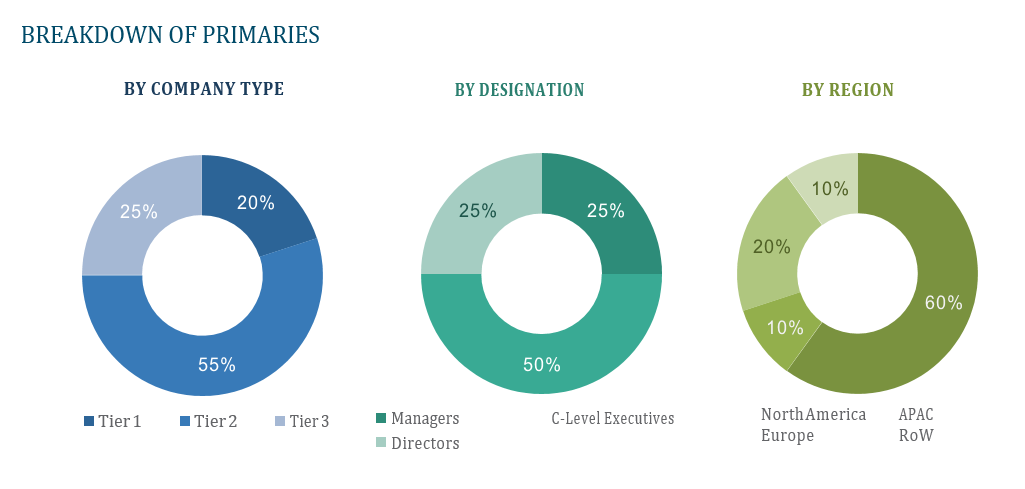
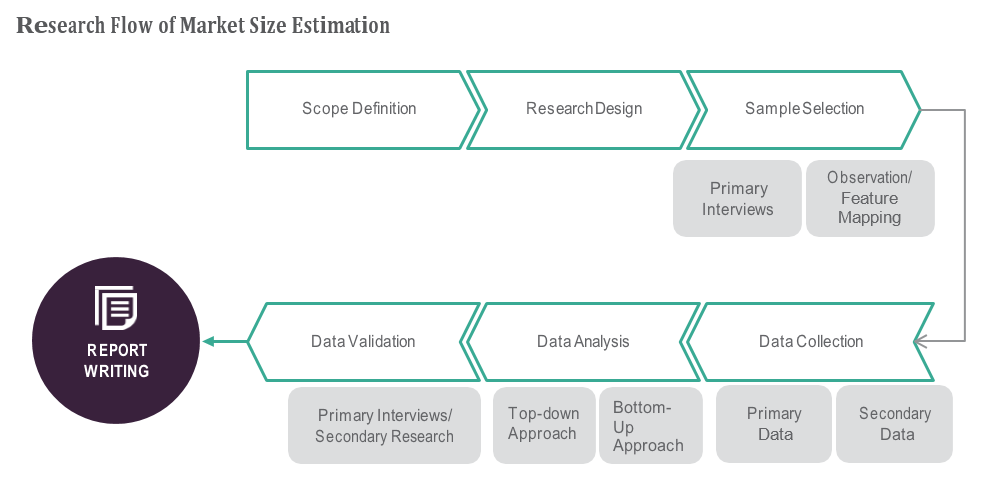

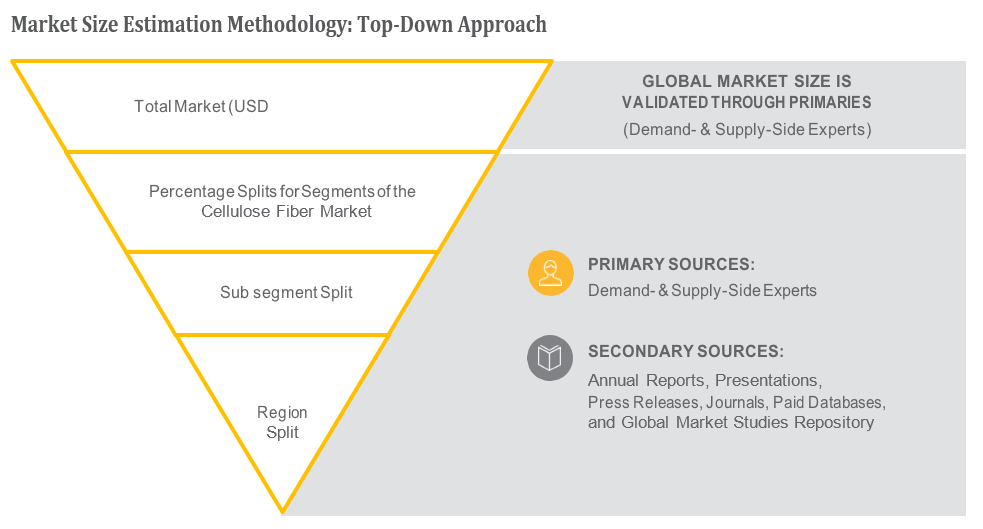
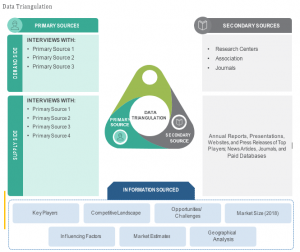
TABLE OF CONTENT
1 Global Interconnects and Passive Components Market
1.1 Study Objectives
1.2 Market Definition
1.3 Study Scope
1.3.1 Markets Covered
1.3.2 Geographic Scope
2 RESEARCH METHODOLOGY
2.1 Research Data
2.1.1 Secondary Data
2.1.1.1 Key Data from Secondary Sources
2.1.2 Primary Data
2.1.2.1 Key Data from Primary Sources
2.1.2.2 Key Industry Insights
2.1.2.3 Breakdown of Primaries
2.2 Market Size Estimation
2.2.1 Bottom-Up Approach
2.2.2 Top-Down Approach
2.3 Market Breakdown and Data Triangulation
2.4 Research Assumptions
3 Global Interconnects and Passive Components Market – Executive Summary
3.1 Market Revenue, Market Size and Key Trends by Company
3.2 Key Trends by type of Application
3.3 Key Trends segmented by Geography
4 Global Interconnects and Passive Components Market – Comparative Analysis
4.1 Product Benchmarking – Top 10 companies
4.2 Top 5 Financials Analysis
4.3 Market Value split by Top 10 companies
4.4 Patent Analysis – Top 10 companies
4.5 Pricing Analysis
5 Global Interconnects and Passive Components Market – Industry Market Entry Scenario
5.1 Regulatory Framework Overview
5.2 New Business and Ease of Doing business index
5.3 Case studies of successful ventures
5.4 Customer Analysis – Top 10 companies
6 Global Interconnects and Passive Components Market – Market Forces
6.1 Introduction
6.2 Market Dynamics
6.2.1 Drivers
6.2.2 Opportunities
6.2.3 Challenges
6.3 Porters Analysis of Market
6.3.1 Bargaining power of suppliers
6.3.2 Bargaining powers of customers
6.3.3 Threat of new entrants
6.3.4 Rivalry among existing players
6.3.5 Threat of substitutes
7 Global Interconnects and Passive Components Market – Strategic Analysis
7.1 Value Chain analysis
7.2 Product Life Cycle
7.3 Supplier and distributor analysis (Market share and product dealing strategies)
8 Global Interconnects and Passive Components Market – By Type (Market Size – &
million/billion)
8.1 Passive Components
8.2 Interconnects
9 Global Interconnects and Passive Components Market – By Application
9.1 Consumer Electronics
9.2 Data Processing
9.3 Telecommunication
9.4 Military and Aerospace
9.5 Automotive
9.6 Industrial
9.7 Healthcare
10 Global Interconnects and Passive Components Market – By Geography (Market Size – &
million/billion)
10.1 Introduction
10.2 North America
10.2.1 US
10.2.2 Canada
10.2.3 Mexico
10.3 Europe
10.3.1 U.K
10.3.2 Germany
10.3.3 Italy
10.3.4 France
10.3.5 Spain
10.3.6 Rest of Europe
10.4 Asia-Pacific
10.4.1 China
10.4.2 Japan
10.4.3 India
10.4.4 South Korea
10.4.5 Rest of APAC
10.5 Rest of the World
10.5.1 South America
10.5.2 Middle East
10.5.3 Africa
11 Global Interconnects and Passive Components Market – Entropy
11.1 New product launches
11.2 M&A’s, collaborations, JVs and partnerships
12 Global Interconnects and Passive Components Market -Company Profile (Key Players)
12.1 Market Share, Company Revenue, Products, M&A, Developments
12.2 TE Connectivity Ltd.
12.3 Amphenol Corporation
12.4 Molex Incorporated
12.5 Hirose Electric Co., Ltd
12.6 Delphi Automotive LLP
12.7 TT Electronics PLC
12.8 Japan Aviation Electronics Industry, Ltd.
12.9 AVX Corporation
12.10 Cisco Systems, Inc.
12.11 Yazaki Corporation
12.12 Company 11 & more
13 Global Interconnects and Passive Components Market – Appendix
13.1 Sources
13.2 Abbreviations


