Mobile Augmented Reality Market by Component (3D Cameras, Displays, Sensors, and Software), Application (Smartphones, Tablets, Personal Digital Assistants (PDA)/Game Consoles, Smart Glasses, and Wearables), Vertical, and Geography – 2024 to 2029

SKU: GMS-547

Format: PDF

Overall Rating
4.5/5

OVERVIEW

The Global Mobile Augmented Reality Market is expected to hit USD 246.84 billion by 2025, growing with a CAGR of 68.82% during the forecast period. Factors such as decline in prices of hardware components, growing interest of large tech companies in augmented reality, increasing demand for smartphones and tablets, increase in the demand for AR apps in the E-commerce sector are driving demand for Mobile Augmented Reality Market.
Mobile augmented reality market by component (3d cameras, displays, sensors, and software), application (smartphones, tablets, personal digital assistants (pda)/game consoles, smart glasses, and wearables), vertical, and geography - 2024 to 2029 1

Mobile augmented reality market by component (3d cameras, displays, sensors, and software), application (smartphones, tablets, personal digital assistants (pda)/game consoles, smart glasses, and wearables), vertical, and geography - 2024 to 2029 2

Mobile augmented reality market by component (3d cameras, displays, sensors, and software), application (smartphones, tablets, personal digital assistants (pda)/game consoles, smart glasses, and wearables), vertical, and geography - 2024 to 2029 3

Mobile augmented reality market by component (3d cameras, displays, sensors, and software), application (smartphones, tablets, personal digital assistants (pda)/game consoles, smart glasses, and wearables), vertical, and geography - 2024 to 2029 4

Mobile augmented reality market by component (3d cameras, displays, sensors, and software), application (smartphones, tablets, personal digital assistants (pda)/game consoles, smart glasses, and wearables), vertical, and geography - 2024 to 2029 5

Mobile augmented reality market by component (3d cameras, displays, sensors, and software), application (smartphones, tablets, personal digital assistants (pda)/game consoles, smart glasses, and wearables), vertical, and geography - 2024 to 2029 6

Mobile augmented reality market by component (3d cameras, displays, sensors, and software), application (smartphones, tablets, personal digital assistants (pda)/game consoles, smart glasses, and wearables), vertical, and geography - 2024 to 2029 7

Mobile augmented reality market by component (3d cameras, displays, sensors, and software), application (smartphones, tablets, personal digital assistants (pda)/game consoles, smart glasses, and wearables), vertical, and geography - 2024 to 2029 8

TABLE OF CONTENT

1 Global Mobile Augmented Reality Market
1.1 Study Objectives
1.2 Market Definition
1.3 Study Scope
1.3.1 Markets Covered
1.3.2 Geographic Scope

2 RESEARCH METHODOLOGY
2.1 Research Data
2.1.1 Secondary Data
2.1.1.1 Key Data from Secondary Sources
2.1.2 Primary Data
2.1.2.1 Key Data from Primary Sources
2.1.2.2 Key Industry Insights
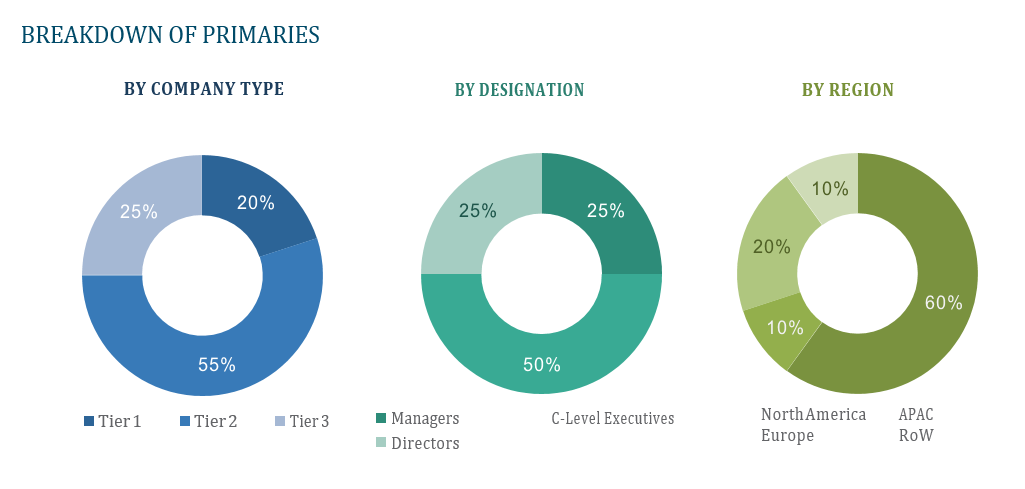
2.1.2.3 Breakdown of Primaries
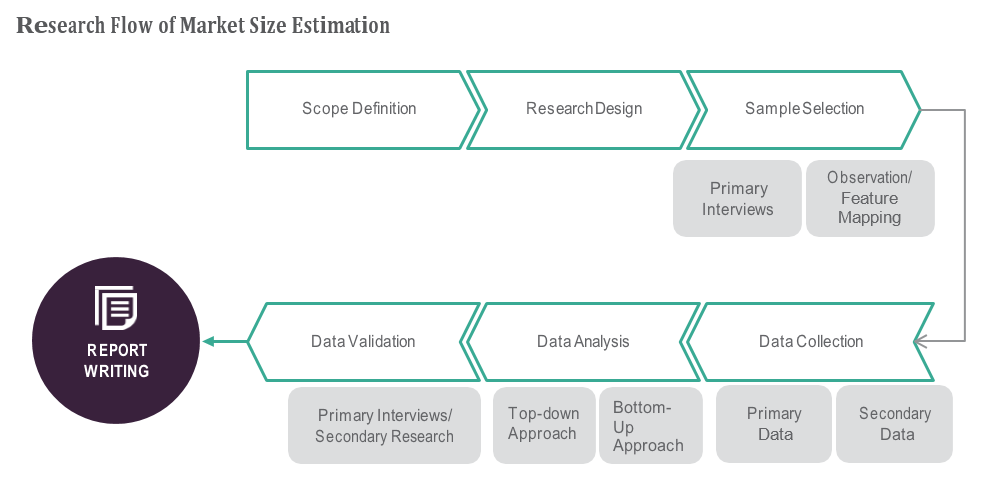
2.2 Market Size Estimation
2.2.1 Bottom-Up Approach
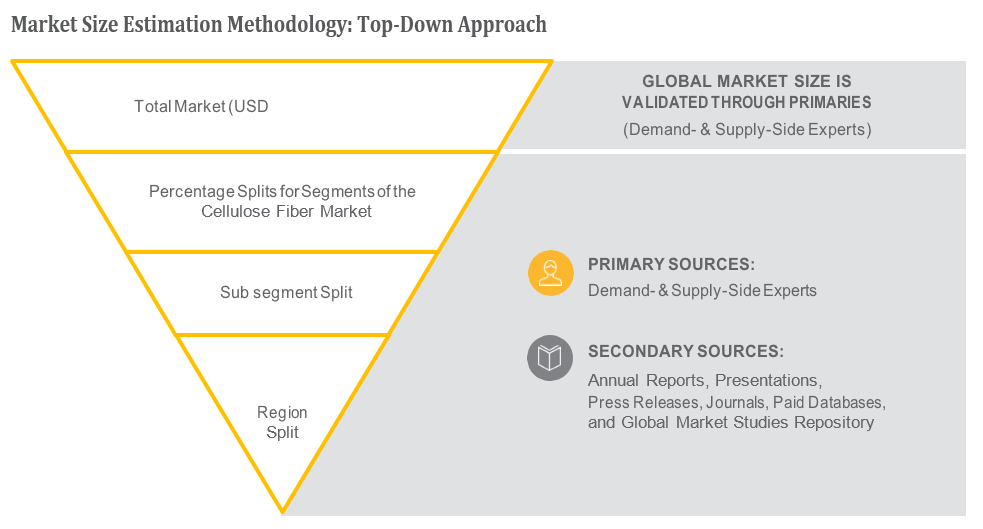
2.2.2 Top-Down Approach
2.3 Market Breakdown and Data Triangulation
2.4 Research Assumptions

3 Global Mobile Augmented Reality Market – Executive Summary
3.1 Market Revenue, Market Size and Key Trends by Company
3.2 Key Trends by type of Application
3.3 Key Trends segmented by Geography

4 Global Mobile Augmented Reality Market – Comparative Analysis
4.1 Product Benchmarking – Top 10 companies
4.2 Top 5 Financials Analysis
4.3 Market Value split by Top 10 companies
4.4 Patent Analysis – Top 10 companies
4.5 Pricing Analysis

5 Global Mobile Augmented Reality Market – Industry Market Entry Scenario
5.1 Regulatory Framework Overview
5.2 New Business and Ease of Doing business index
5.3 Case studies of successful ventures
5.4 Customer Analysis – Top 10 companies

6 Global Mobile Augmented Reality Market – Market Forces
6.1 Introduction
6.2 Market Dynamics
6.2.1 Drivers
6.2.2 Opportunities
6.2.3 Challenges
6.3 Porters Analysis of Market
6.3.1 Bargaining power of suppliers
6.3.2 Bargaining powers of customers
6.3.3 Threat of new entrants
6.3.4 Rivalry among existing players
6.3.5 Threat of substitutes

7 Global Mobile Augmented Reality Market – Strategic Analysis
7.1 Value Chain analysis
7.2 Product Life Cycle
7.3 Supplier and distributor analysis (Market share and product dealing strategies)

8 Global Mobile Augmented Reality Market – By Component (Market Size – & million/billion)
8.1 Software
8.2 Hardware

9 Global Mobile Augmented Reality Market – By Vertical
9.1 Medical
9.2 Aerospace and Defense
9.3 Consumer
9.4 Commercial
9.5 Industrial

10 Global Mobile Augmented Reality Market – By Application
10.1 Tablets
10.2 Personal Digital Assistants (PDA) and Game Consoles
10.3 Smartphones
10.4 Smart Glasses and Wearables

11 Global Mobile Augmented Reality Market – By Geography (Market Size – & million/billion)
11.1 Introduction
11.2 North America
11.2.1 US
11.2.2 Canada
11.2.3 Mexico
11.3 Europe
11.3.1 U.K
11.3.2 Germany
11.3.3 Italy
11.3.4 France
11.3.5 Spain
11.3.6 Rest of Europe
11.4 Asia-Pacific
11.4.1 China
11.4.2 Japan
11.4.3 India
11.4.4 South Korea
11.4.5 Rest of APAC
11.5 Rest of the World
11.5.1 South America
11.5.2 Middle East
11.5.3 Africa

12 Global Mobile Augmented Reality Market – Entropy
12.1 New product launches
12.2 M&A’s, collaborations, JVs and partnerships

13 Global Mobile Augmented Reality Market – Company Profile (Key Players)
13.1 Market Share, Company Revenue, Products, M&A, Developments
13.2 Google Inc.
13.3 Samsung Electronics Co. Ltd.
13.4 Blippar.Com Ltd.
13.5 Metaio GmbH
13.6 Qualcomm Inc.
13.7 Daqri Llc
13.8 Wikitude GmbH
13.9 Microsoft Corporation
13.10 Infinity Augmented Reality Inc.
13.11 Catchoom Technologies
13.12 Company 11 & more

14 Global Mobile Augmented Reality Market – Appendix
14.1 Sources
14.2 Abbreviations

Share

Get A Free Sample

Take a look at this complimentary sample which comprises of a variety of market data points such as trend analyses, market estimates, and forecasts. You can explore and evaluate it on your own.

Send me Free Sample

Or View Our License Options:

$3,850.00$5,850.00

Why

Industry Coverage: Global Market Studies has a broad range of industry coverage, spanning various sectors such as healthcare, technology, retail, automotive, and many others. This means that clients can rely on us to provide valuable insights into their respective industries, helping them make informed business decisions.

Our team of experts has years of experience in the market research industry, and they have honed their skills in data analysis, market forecasting, and trend analysis. They are also adept at using advanced research tools and techniques to gather and analyze data, providing clients with accurate and reliable insights.

We understand that each client has unique research needs, and we tailor our research solutions to meet their specific requirements. We work closely with our clients to understand their objectives and provide customized research solutions that address their business challenges.

We are committed to innovation and are constantly exploring new research methods and techniques to provide our clients with cutting-edge insights. This enables us to stay ahead of the curve and deliver the best possible research outcomes.

At Global Market Studies, our clients are at the center of everything we do. We pride ourselves on providing excellent customer service and support, and we are always available to address our clients’ concerns and questions.

83422+ Reports Delivered

Accurate market data is crucial to a successful business strategy. With an 85% + accuracy in all reports, makes us one of the best and most accurate firms in the world.

Need Customized Report ?Call Now

OVERVIEW

The Global Mobile Augmented Reality Market is expected to hit USD 246.84 billion by 2025, growing with a CAGR of 68.82% during the forecast period. Factors such as decline in prices of hardware components, growing interest of large tech companies in augmented reality, increasing demand for smartphones and tablets, increase in the demand for AR apps in the E-commerce sector are driving demand for Mobile Augmented Reality Market.

Mobile augmented reality market by component (3d cameras, displays, sensors, and software), application (smartphones, tablets, personal digital assistants (pda)/game consoles, smart glasses, and wearables), vertical, and geography - 2024 to 2029 9

Mobile augmented reality market by component (3d cameras, displays, sensors, and software), application (smartphones, tablets, personal digital assistants (pda)/game consoles, smart glasses, and wearables), vertical, and geography - 2024 to 2029 10

Mobile augmented reality market by component (3d cameras, displays, sensors, and software), application (smartphones, tablets, personal digital assistants (pda)/game consoles, smart glasses, and wearables), vertical, and geography - 2024 to 2029 11

Mobile augmented reality market by component (3d cameras, displays, sensors, and software), application (smartphones, tablets, personal digital assistants (pda)/game consoles, smart glasses, and wearables), vertical, and geography - 2024 to 2029 12

Mobile augmented reality market by component (3d cameras, displays, sensors, and software), application (smartphones, tablets, personal digital assistants (pda)/game consoles, smart glasses, and wearables), vertical, and geography - 2024 to 2029 13

Mobile augmented reality market by component (3d cameras, displays, sensors, and software), application (smartphones, tablets, personal digital assistants (pda)/game consoles, smart glasses, and wearables), vertical, and geography - 2024 to 2029 14

Mobile augmented reality market by component (3d cameras, displays, sensors, and software), application (smartphones, tablets, personal digital assistants (pda)/game consoles, smart glasses, and wearables), vertical, and geography - 2024 to 2029 15

Mobile augmented reality market by component (3d cameras, displays, sensors, and software), application (smartphones, tablets, personal digital assistants (pda)/game consoles, smart glasses, and wearables), vertical, and geography - 2024 to 2029 16

TABLE OF CONTENT

1 Global Mobile Augmented Reality Market
1.1 Study Objectives
1.2 Market Definition
1.3 Study Scope
1.3.1 Markets Covered
1.3.2 Geographic Scope

2 RESEARCH METHODOLOGY
2.1 Research Data
2.1.1 Secondary Data
2.1.1.1 Key Data from Secondary Sources
2.1.2 Primary Data
2.1.2.1 Key Data from Primary Sources
2.1.2.2 Key Industry Insights
2.1.2.3 Breakdown of Primaries
2.2 Market Size Estimation
2.2.1 Bottom-Up Approach
2.2.2 Top-Down Approach
2.3 Market Breakdown and Data Triangulation
2.4 Research Assumptions

3 Global Mobile Augmented Reality Market – Executive Summary
3.1 Market Revenue, Market Size and Key Trends by Company
3.2 Key Trends by type of Application
3.3 Key Trends segmented by Geography

4 Global Mobile Augmented Reality Market – Comparative Analysis
4.1 Product Benchmarking – Top 10 companies
4.2 Top 5 Financials Analysis
4.3 Market Value split by Top 10 companies
4.4 Patent Analysis – Top 10 companies
4.5 Pricing Analysis

5 Global Mobile Augmented Reality Market – Industry Market Entry Scenario
5.1 Regulatory Framework Overview
5.2 New Business and Ease of Doing business index
5.3 Case studies of successful ventures
5.4 Customer Analysis – Top 10 companies

6 Global Mobile Augmented Reality Market – Market Forces
6.1 Introduction
6.2 Market Dynamics
6.2.1 Drivers
6.2.2 Opportunities
6.2.3 Challenges
6.3 Porters Analysis of Market
6.3.1 Bargaining power of suppliers
6.3.2 Bargaining powers of customers
6.3.3 Threat of new entrants
6.3.4 Rivalry among existing players
6.3.5 Threat of substitutes

7 Global Mobile Augmented Reality Market – Strategic Analysis
7.1 Value Chain analysis
7.2 Product Life Cycle
7.3 Supplier and distributor analysis (Market share and product dealing strategies)

8 Global Mobile Augmented Reality Market – By Component (Market Size – & million/billion)
8.1 Software
8.2 Hardware

9 Global Mobile Augmented Reality Market – By Vertical
9.1 Medical
9.2 Aerospace and Defense
9.3 Consumer
9.4 Commercial
9.5 Industrial

10 Global Mobile Augmented Reality Market – By Application
10.1 Tablets
10.2 Personal Digital Assistants (PDA) and Game Consoles
10.3 Smartphones
10.4 Smart Glasses and Wearables

11 Global Mobile Augmented Reality Market – By Geography (Market Size – & million/billion)
11.1 Introduction
11.2 North America
11.2.1 US
11.2.2 Canada
11.2.3 Mexico
11.3 Europe
11.3.1 U.K
11.3.2 Germany
11.3.3 Italy
11.3.4 France
11.3.5 Spain
11.3.6 Rest of Europe
11.4 Asia-Pacific
11.4.1 China
11.4.2 Japan
11.4.3 India
11.4.4 South Korea
11.4.5 Rest of APAC
11.5 Rest of the World
11.5.1 South America
11.5.2 Middle East
11.5.3 Africa

12 Global Mobile Augmented Reality Market – Entropy
12.1 New product launches
12.2 M&A’s, collaborations, JVs and partnerships

13 Global Mobile Augmented Reality Market – Company Profile (Key Players)
13.1 Market Share, Company Revenue, Products, M&A, Developments
13.2 Google Inc.
13.3 Samsung Electronics Co. Ltd.
13.4 Blippar.Com Ltd.
13.5 Metaio GmbH
13.6 Qualcomm Inc.
13.7 Daqri Llc
13.8 Wikitude GmbH
13.9 Microsoft Corporation
13.10 Infinity Augmented Reality Inc.
13.11 Catchoom Technologies
13.12 Company 11 & more

14 Global Mobile Augmented Reality Market – Appendix
14.1 Sources
14.2 Abbreviations

Download our eBook: Market Mastery

Unleashing revenue potential through strategic market research involves identifying untapped market opportunities, understanding consumer needs and preferences, and developing targeted strategies to capitalize on them. By leveraging data-driven insights, businesses can optimize product offerings, pricing strategies, and marketing efforts to drive revenue growth and stay ahead of competitors.

Related Research Reports