OVERVIEW
The market for zero liquid discharge systems is projected to reach USD 8.76 billion by 2024, increasing at CAGR by 7.9% from 2019 to 2024. Rising concerns about the disposal of brine concentrates in water bodies are expected to drive the demand for reduced liquid discharge. Morover, growing demand from the region of South America from end-use industries such as energy & power is also expected to fuel demand for zero liquid discharge systems.
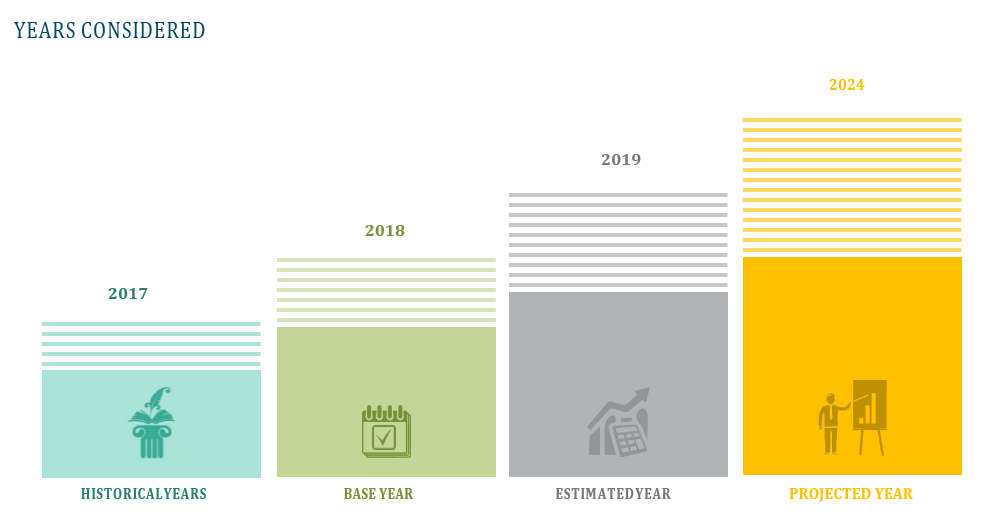


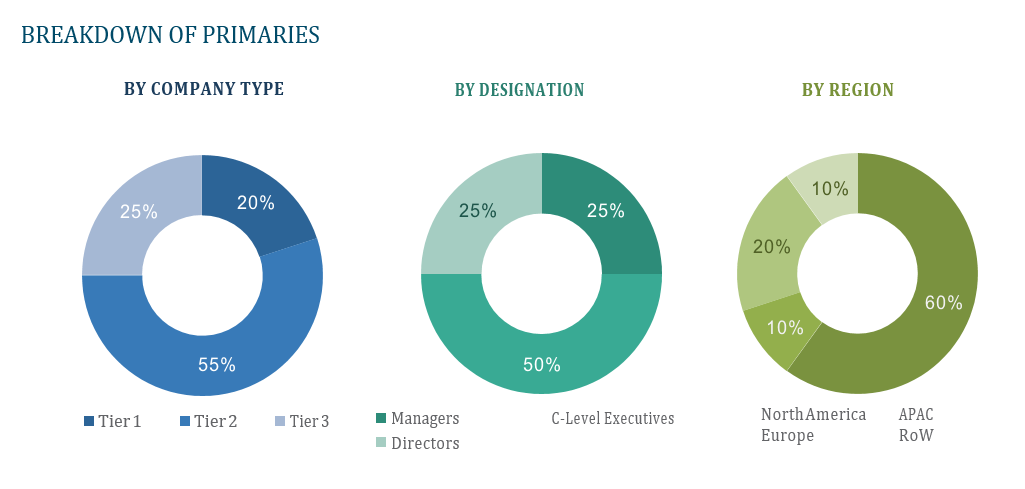
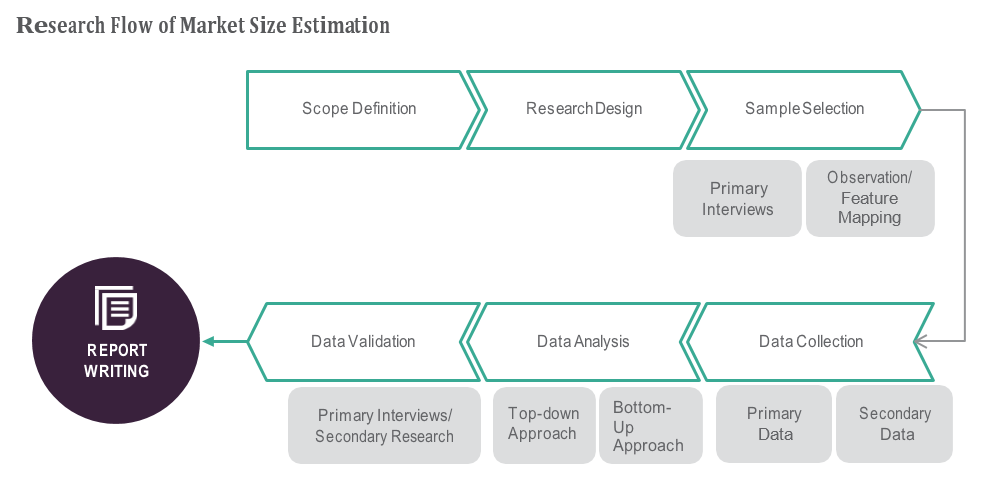

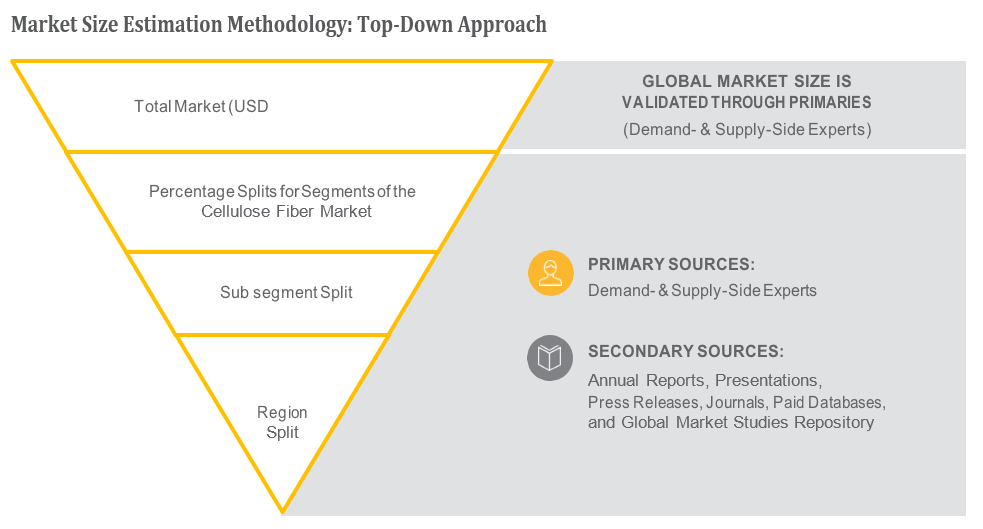
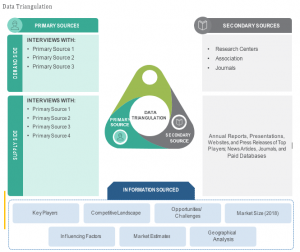
TABLE OF CONTENT
1 Global Zero Liquid Discharge Systems Market
1.1 Study Objectives
1.2 Market Definition
1.3 Study Scope
1.3.1 Markets Covered
1.3.2 Geographic Scope
2 RESEARCH METHODOLOGY
2.1 Research Data
2.1.1 Secondary Data
2.1.1.1 Key Data From Secondary Sources
2.1.2 Primary Data
2.1.2.1 Key Data From Primary Sources
2.1.2.2 Key Industry Insights
2.1.2.3 Breakdown of Primaries
2.2 Market Size Estimation
2.2.1 Bottom-Up Approach
2.2.2 Top-Down Approach
2.3 Market Breakdown and Data Triangulation
2.4 Research Assumptions
3 Global Zero Liquid Discharge Systems Market – Executive Summary
3.1 Market Revenue, Market Size and Key Trends by Company
3.2 Key Trends by type of Application
3.3 Key Trends segmented by Geography
4 Global Zero Liquid Discharge Systems Market – Market Forces
4.1 Introduction
4.2 Market Dynamics
4.2.1 Drivers
4.2.2 Opportunities
4.2.3 Challenges
4.3 Porters Analysis of Market
4.3.1 Bargaining power of suppliers
4.3.2 Bargaining powers of customers
4.3.3 Threat of new entrants
4.3.4 Rivalry among existing players
4.3.5 Threat of substitutes
5 Global Zero Liquid Discharge Systems Market – Strategic Analysis
5.1 Value Chain analysis
5.2 Product Life Cycle
6 Global Zero Liquid Discharge Systems Market – By Systems (Market Size – & million/billion)
6.1 Conventional ZLD systems
6.2 Hybrid ZLD systems
7 Global Zero Liquid Discharge Systems Market – By Process
7.1 Pretreatment
7.2 Filtration
7.3 Evaporation & Crystallization
8 Global Zero Liquid Discharge Systems Market – By End-User
8.1 Energy & Power
8.2 Chemicals & Petrochemicals
8.3 Foods & Beverages
8.4 Textiles
8.5 Pharmaceuticals
8.6 Semiconductors & Electronics
8.7 Others
9 Global Zero Liquid Discharge Systems Market – By Geography (Market Size – &
million/billion)
9.1 Introduction
9.2 North America
9.2.1 US
9.2.2 Canada
9.2.3 Mexico
9.3 Europe
9.3.1 U.K
9.3.2 Germany
9.3.3 Italy
9.3.4 France
9.3.5 Spain
9.3.6 Rest of Europe
9.4 Asia-Pacific
9.4.1 China
9.4.2 Japan
9.4.3 India
9.4.4 South Korea
9.4.5 Rest of APAC
9.5 Rest of the World
9.5.1 South America
9.5.2 Middle East
9.5.3 Africa
10 Global Zero Liquid Discharge Systems Market – Entropy
10.1 New product launches
10.2 M&A’s, collaborations, JVs and partnerships
11 Global Zero Liquid Discharge Systems Market Company Profile (Key Players)
11.1 Market Share, Company Revenue, Products, M&A, Developments
11.2 SUEZ Water Technologies & Solutions
11.3 Veolia Water Technologies
11.4 GEA Group AG
11.5 H2o GmbH
11.6 Aquarion AG
11.7 Saltworks Technologies Inc.
11.8 Safbon Water Technology
11.9 Praj Industries Ltd.
11.10 Aquatech International LLC
11.11 U.S. Water Services, Inc.
11.12 Company 11 & more
12 Global Zero Liquid Discharge Systems Market – Appendix
12.1 Sources
12.2 Abbreviations


